An interest of mine has always been visualising data in Trinidad & Tobago. About a year ago I decided to find a data source from Trinidad & Tobago, put it on a map and see what it looked like. Little did I know that this wasn’t going to be easy.
Finding a proper data source to plot was almost a complete waste of time. I spent an entire day searching the web, hoping to find some data about Trinidad & Tobago that could be useful, turns out there wasn’t really much; what I did find wasn’t really helpful to me.
What I needed was data that could be plotted geographically across Trinidad & Tobago, basically any data with latitude and longitude.
I came across the Trinidad and Tobago Meteorological Service (TTMS) website which offered climate data that was recorded daily since 1981; data such as precipitation and minimum and maximum temperature on that day.
However only Piarco and Crown Point were in the data set and I couldn’t download the data. I thought about writing a script to scrape the data, but with only Piarco and Crown Point in the data set, there was no point, I needed all of Trinidad & Tobago.
I came across the Central Statistical Office (CSO) website, which was interesting. There was a lot of categories I could sift through and the data is downloadable in either a CSV or a PDF.
Sadly, I couldn’t use any of the data, there was nothing available by region (at the time I looked) for Trinidad & Tobago, almost all the data focused on Trinidad & Tobago as a whole.
I may use some data from the CSO in a visual graphing project, there’s a few interactive graphs that would fit very well with some data sets that the CSO provides.
There were several other sites I came across: data.worldbank.org, data.un.org, cia.gov (central intelligence agency world fact book to be precise), and several others.
Most of the data sets I found were very useful and can be used in many ways, but not really much I could plot on a map.
I was ready to give up searching for a data source and create my own, but after a few more searches I found a document compiled with a list of murders committed in Trinidad & Tobago in 2016. It seemed the author of the document complied the data from several local newspapers in Trinidad & Tobago.
The document contained names, dates, locations, type of crime committed and how it was done. This document was exactly what I needed, mainly because it had locations and a location has a latitude and longitude.
The data was in a 63-page Microsoft word document. It contained every murder starting at the beginning of January 2016 to the end of December 2016. There was the deceased name, how they died, where they died and the day they died. It also contained links pointing to various news sources. My credit to the author of the document, they had really done their research.
To format the data I converted the document to a plain text file, this removed all Microsoft Word styles embedded in the document. I then used regular expressions to parse the document and remove portions of text I didn’t need.
After a few hours of massaging the data, I managed to create a CSV (comma separated value) file, with a record of each murder.
Then came the next problem. The location of the crimes were names of places, and not coordinates. The idea of having to manually find and enter the latitude and longitude for each crime made me cringe; but I had an easier method.
When I built Hermitt.biz I created a database of boroughs and towns in Trinidad & Tobago. Each town has a latitude and longitude, size of population, elevation, digital elevation model and some other data I though might be useful.
The idea was when members register or post ads, it would be easier for them to select their location from a menu, instead of having to type it in manually.
I loaded the CSV data into an SQL table and the list of towns in another table, and ran a simple “SELECT…LIKE” query comparing the names of towns to the locations of the deceased. I got about 95% of the results matched, the other 5% I did manually, which didn’t take very long.
Eventually I had my data formatted and had everything I needed to plot on a map. I then realized if two people died in the same location the map markers would overlap, because the latitude and longitude would be on the same exact spot.
Most of the locations in the document weren’t exactly precise, but that’s not the authors fault, it’s just how news is reported. I knew at this point the map was not going to be 100% accurate, but at least it would give a general idea of where murders are committed.
I looked at a few mapping API’s but decided to go with Google Maps, simply because the documentation was extensive. I also use a marker cluster library to help group together markers depending on the zoom level of the map.
The interactive map portion is written in JavaScript, which loads a geoJSON file, parses it and plots it.
As I mentioned before, if two people died in the same location, the map markers would overlap. When I skimmed through the data source, there were several records that had the same exact latitude and longitude.
I decided that if two markers shared the same exact location I could give their position a slight variance and offset them from each other, this way the markers are still in the same town, but not overlapping.
After a little trial and error, I ended up with a map with some interesting results.
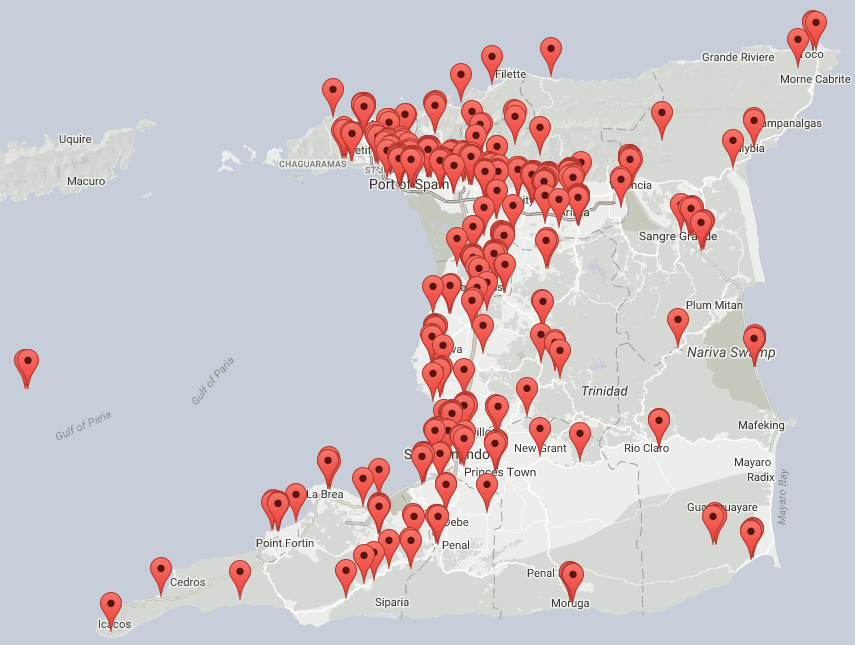
Here are the results for Trinidad. First thing I noticed was the density of markers in the North, North West, West and South West.
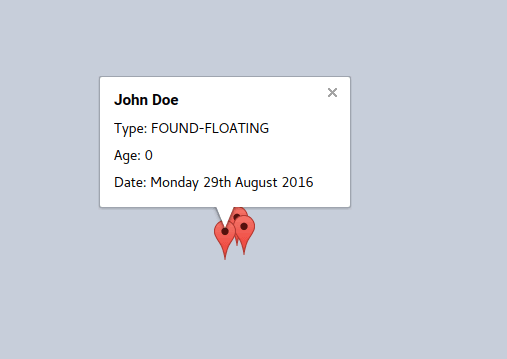
Then I noticed the markers in the ocean. At first I thought it was a mistake, I checked the record on the map and it seemed fine. To verify it, I went back into the database and looked at the actual record.
What I found was three bodies had been found found floating in the Gulf of Paria. One body was a John Doe and the other two were identified.
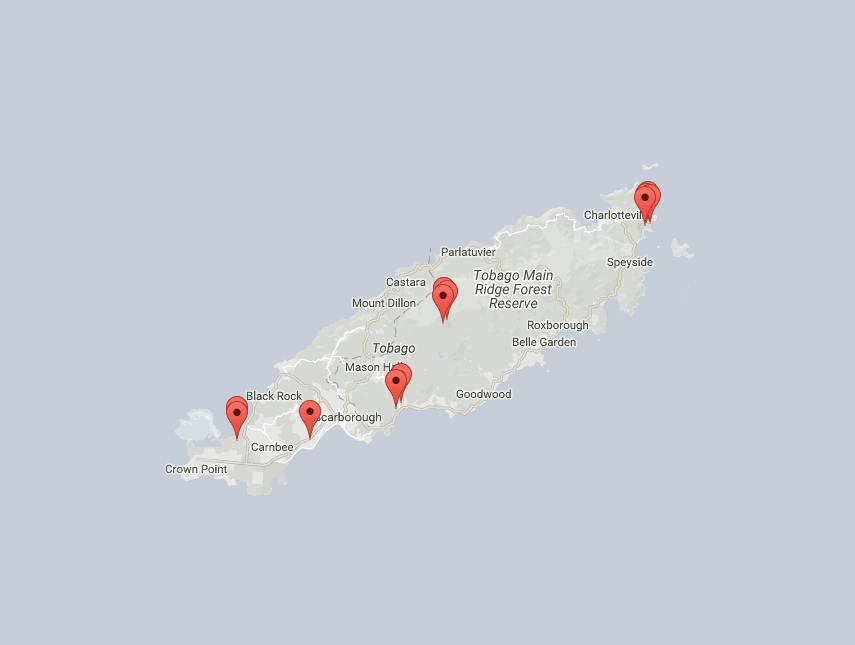
The results for Tobago obviously wasn’t as extensive as it was for Trinidad; being that Tobago has a much smaller population, this was expected.
After looking at the map, I tried to find other data sources for the past 15-20 years, but what I found was no where near what the original document I found had produced for me. Looking at data over time, can show changes and trends that one year alone can’t identify.
As I started, this was just project in visualising data for Trinidad & Tobago. The results aren’t exactly 100% accurate as I had mentioned before, but it definitely does give some context.
If you would like to take a look at the interactive map, you can do so here 2016 Trinidad & Tobago murders
In a previous article I wrote about creating and registering a new twitter application. Creating…
Creating a new Twitter application requires several important steps. First we must register a new application,…
Anyone familiar with the old search console knows that manually adding each URL or even…
On Monday March 26th, Fishermen and Friends of the Sea (FFOS) had their request for…
In my last blog post I shared some statistical information on diabetes in Trinidad &…
I my last blog post I wrote about diabetes in Trinidad & Tobago and tried…