I decided to rework the historical agricultural prices graph I did a few weeks ago and re-purpose it to display the yearly average price of agriculture items in Trinidad & Tobago.
You can visit the interactive graph and select from over 50+ items in the list to see the average yearly prices since 2006. The data comes from the NAMIS website, which is the same data source I used for the historical agricultural prices blog post.
Link: Agriculture Average Yearly Prices
Here is some sample data I hand picked and generated images for. These items stood out because of the price consistency, price spikes, and price consistency.
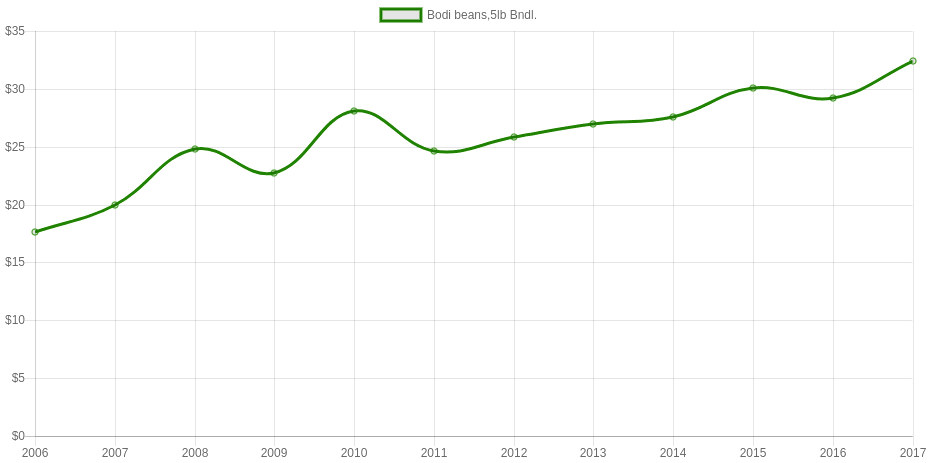
Bodi has been fairly consistent over the past several years. This year it seems to be slightly cheaper than it was last year. Notice the fluctuations in 2008-20011?
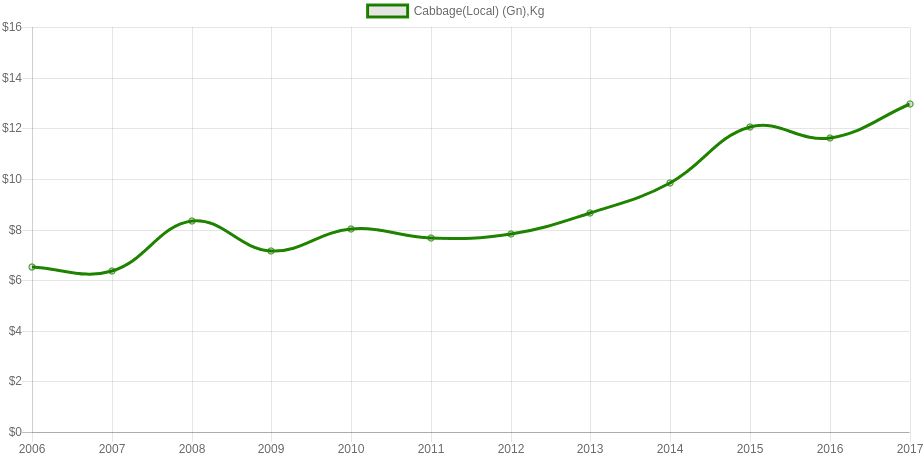
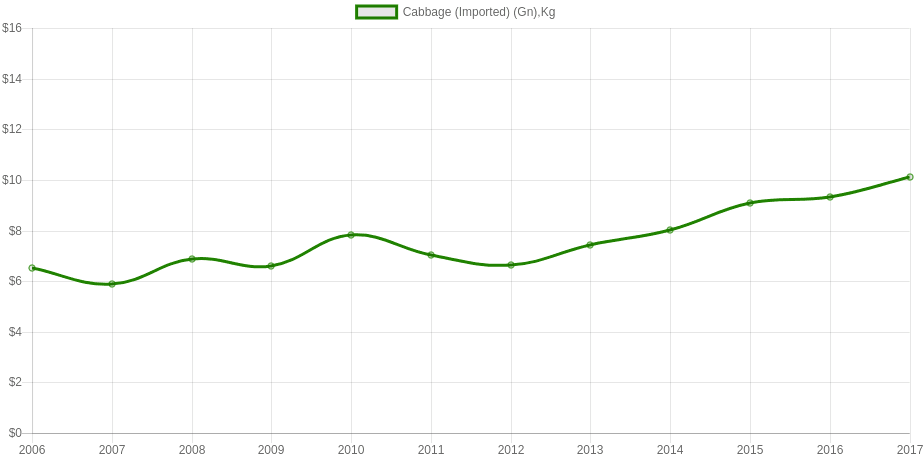
I looked at local and imported cabbage and realised that local cabbage was actually more expensive than imported cabbage. This is not something new, local farmers have been complaining for years that the price of imported items is unfair. Nonetheless, supermarkets prefer to buy and sell cheaper imported items.
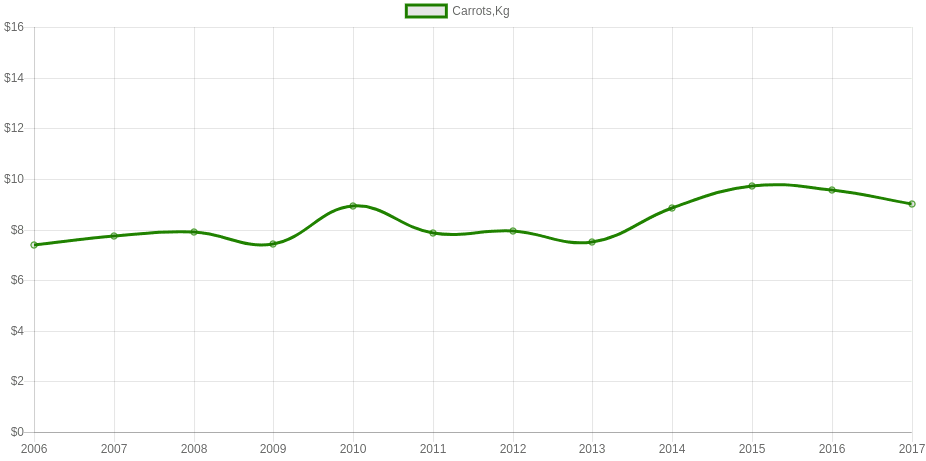
The average price of carrots saw a steady increase from 2013-2015, it appears that it’s now on a decline.
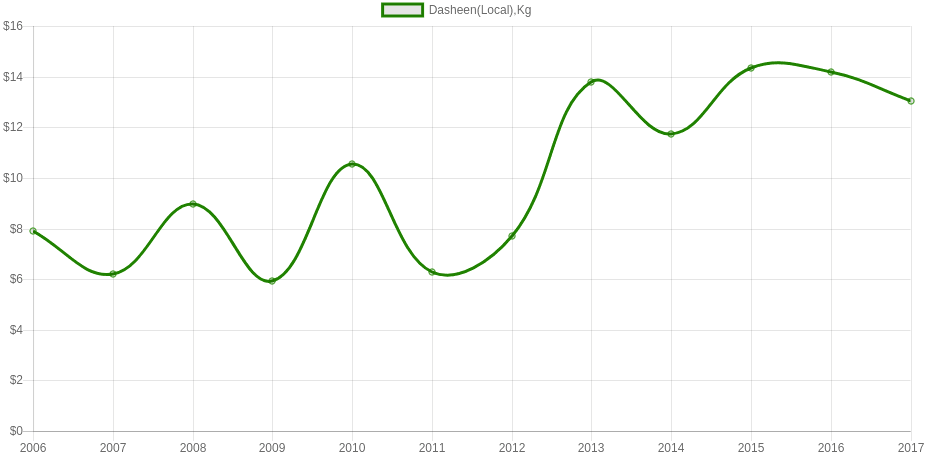
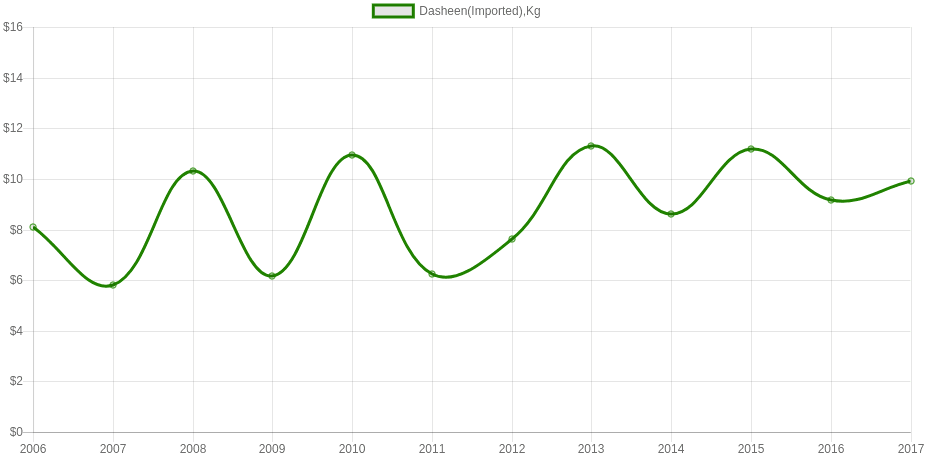
Here is a yearly average price comparison between local dasheen and imported dasheen. Look at the disparity from 2012-2017; the average price of local dasheen exceeds the imported.
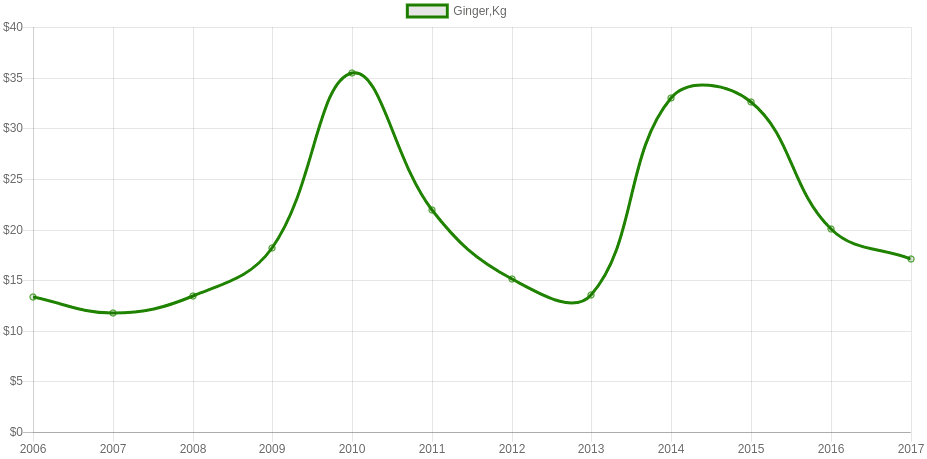
Ginger was slightly bizarre. Reason being the spike in 2010, then the decline from 2011-2013. However, it spiked again in 2014 and it seems to be on a decline for now.
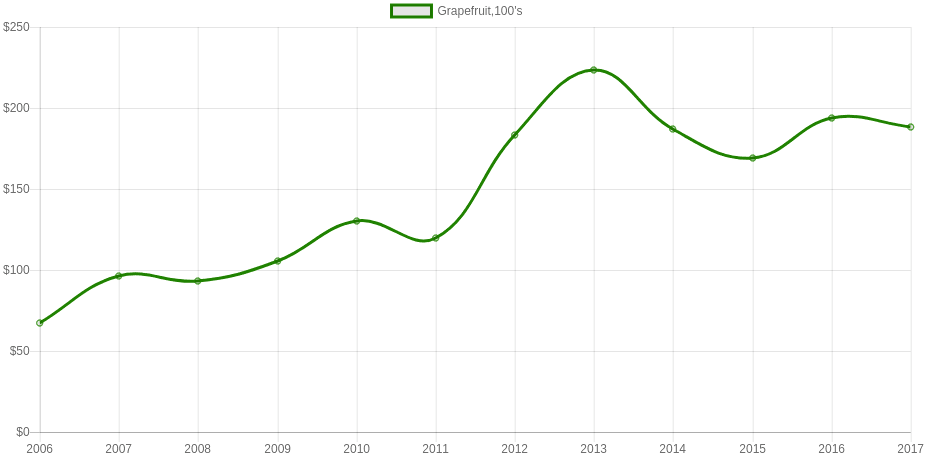
Grapefruit saw a spike in 2012-2013, followed by a decline and then another rise.
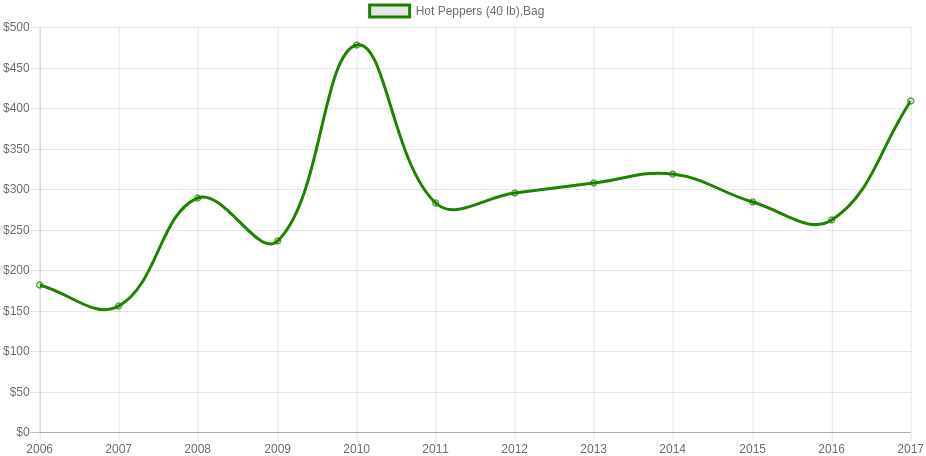
I included hot peppers to showcase the spike in 2011, and then its sharp drop in 2012.
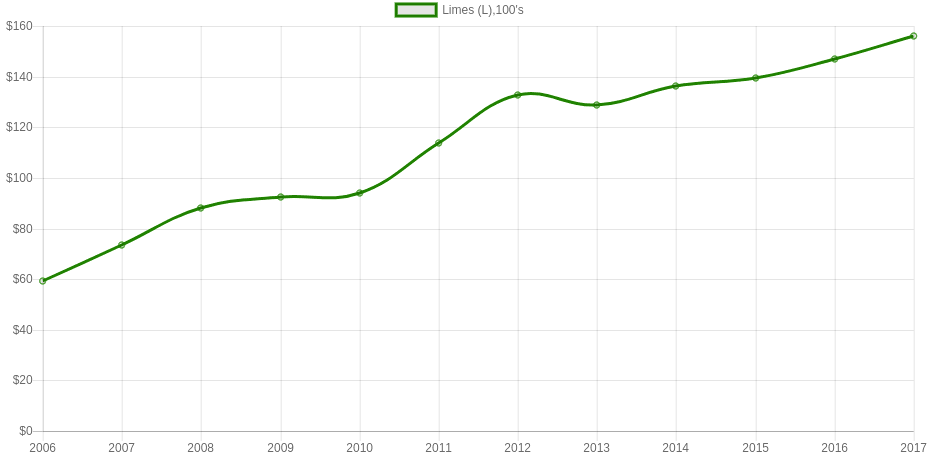
Lime was one of the more interesting ones. Its been steadily increasing over the years.
As I had previously mentioned, the interactive graph has a lot more agricultural items to look at. Most of the food items will show an increase in price over the years, which is to be expected; inflation, valuation of the dollar, supply and demand, bad weather…etc are just some of the reasons why food prices are on the rise in Trinidad & Tobago.
In a previous article I wrote about creating and registering a new twitter application. Creating…
Creating a new Twitter application requires several important steps. First we must register a new application,…
Anyone familiar with the old search console knows that manually adding each URL or even…
On Monday March 26th, Fishermen and Friends of the Sea (FFOS) had their request for…
In my last blog post I shared some statistical information on diabetes in Trinidad &…
I my last blog post I wrote about diabetes in Trinidad & Tobago and tried…